The diagram below shows the market demand curve and the cost curves for a single firm. 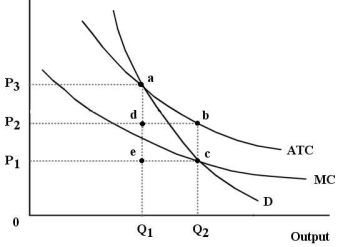 FIGURE 12-6
-Refer to Figure 12-6. Suppose the firm is being regulated using a policy of average-cost pricing.The resulting price and output would be
A) P1 and Q₂.
B) P3 and Q₂.
C) P1 and Q₁.
D) P2 and Q₂.
E) P3 and Q₁.
Correct Answer:
Verified
Q3: Choose the statement that best compares the
Q4: All points on a country's production possibilities
Q5: Q6: Monopoly is allocatively inefficient because Q10: Suppose we compare two monopolists with identical Q13: For an entire economy, allocative efficiency requires Q16: In the absence of market failures, allocative Q17: Consider a regulated natural monopoly, such as Q20: When comparing a perfectly competitive firm and Q37: The deadweight loss of monopoly is![]()
A) the price
A) the
Unlock this Answer For Free Now!
View this answer and more for free by performing one of the following actions

Scan the QR code to install the App and get 2 free unlocks

Unlock quizzes for free by uploading documents