The diagram below shows the demand and supply curves in a perfectly competitive market. 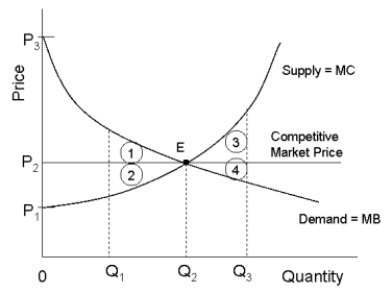 FIGURE 12-5
-Refer to Figure 12-5. If output in this market were Q₃, and the price was still equal to itsfree-market level, the loss in producer surplus relative to the competitive equilibrium would be illustrated by area
A) 3 + 4.
B) 4.
C) 1.
D) 2.
E) 3.
Correct Answer:
Verified
Q8: Choose the statement that best describes the
Q11: In general, the sum of consumer and
Q12: the regulatory body often ends up protecting
Q14: Suppose your municipality charges your household a
Q15: The diagram below shows the demand and
Q16: In the absence of market failures, allocative
Q19: allocative efficiency.
A) 1 only
B) 2 only
C) 3
Q19: Consider three firms, A, B and C,
Q27: Regulated monopolies that face rising long- run
Q37: The deadweight loss of monopoly is
A) the
Unlock this Answer For Free Now!
View this answer and more for free by performing one of the following actions

Scan the QR code to install the App and get 2 free unlocks

Unlock quizzes for free by uploading documents