The diagram below shows cost and revenue curves for a natural monopoly producing electricity. Price is dollars per kilowatt hour and quantity is kilowatt hours per day. 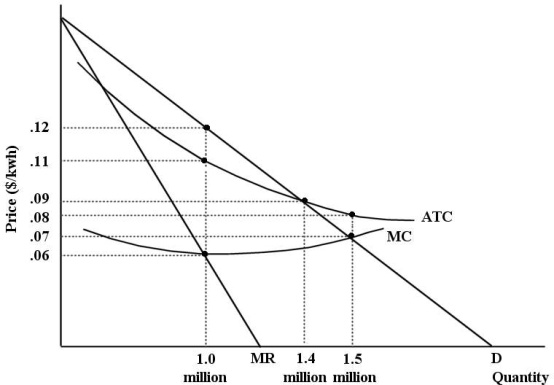 FIGURE 12- 7
-Refer to Figure 12- 7. Suppose this firm is being regulated using a policy of marginal- cost pricing. In this case, economic profits are equal to
A) $90 000.
B) - $28 000.
C) - $15 000.
D) $0.
E) - $50 000.
Correct Answer:
Verified
Q18: In the long run, the imposition of
Q19: Consider three firms, A, B and C,
Q20: When comparing a perfectly competitive firm and
Q21: The diagram below shows supply, demand, and
Q22: In Canada, a significant challenge for the
Q24: Productive efficiency for an individual firm requires
Q25: An allowable defense for a merger according
Q26: The production possibilities boundary shows possible combinations
Q27: Regulated monopolies that face rising long- run
Q28: In principle, a comparison of the long-
Unlock this Answer For Free Now!
View this answer and more for free by performing one of the following actions

Scan the QR code to install the App and get 2 free unlocks

Unlock quizzes for free by uploading documents