The diagram below shows cost and revenue curves for a natural monopoly producing electricity. Price is dollars per kilowatt hour and quantity is kilowatt hours per day. 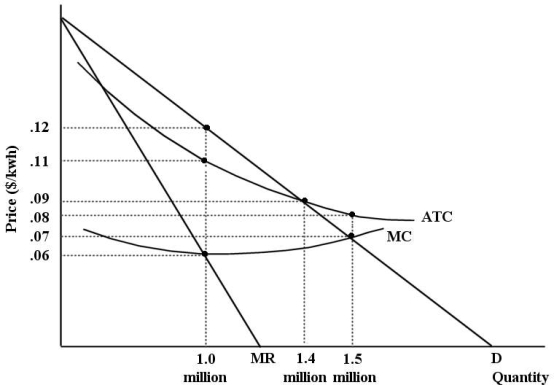 FIGURE 12- 7
-Refer to Figure 12- 7. Suppose this firm is being regulated using a policy of marginal- cost pricing. The resulting price and output would be per kwh and kwh per day.
A) $0.09; 1.4 million
B) $0.06; 1 million
C) $0.08; 1.5 million
D) $0.07; 1.5 million
E) $0.12; 1 million
Correct Answer:
Verified
Q26: The production possibilities boundary shows possible combinations
Q27: Regulated monopolies that face rising long- run
Q28: In principle, a comparison of the long-
Q29: A monopolist's pricing and output behaviour
A) increases
Q30: There has been a trend toward less
Q32: Which of the following is the definition
Q33: The diagram below shows supply, demand, and
Q34: Suppose a cell- phone service provider has
Q35: Canadian governments (federal, provincial and municipal) employ
Q36: The diagram below shows supply, demand, and
Unlock this Answer For Free Now!
View this answer and more for free by performing one of the following actions

Scan the QR code to install the App and get 2 free unlocks

Unlock quizzes for free by uploading documents