The diagram below shows the market demand curve and the cost curves for a single firm. 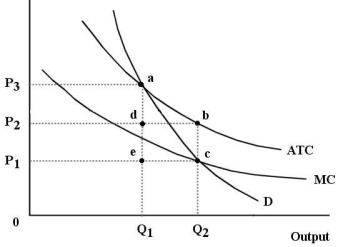 FIGURE 12-6
-Refer to Figure 12-6. Suppose this firm is being regulated using a policy of marginal-cost pricing.In this case, the firm would experience represented by the area .
A) losses; 0P2bQ₂
B) profits; P2P3ad
C) profits; edbc
D) losses; edbc
E) losses; P1P2bc
Correct Answer:
Verified
Q21: The diagram below shows supply, demand, and
Q22: In Canada, a significant challenge for the
Q23: The diagram below shows cost and revenue
Q24: Productive efficiency for an individual firm requires
Q25: An allowable defense for a merger according
Q26: The production possibilities boundary shows possible combinations
Q28: In principle, a comparison of the long-
Q29: A monopolist's pricing and output behaviour
A) increases
Q35: Canadian governments (federal, provincial and municipal) employ
Q47: Consider two firms, A and B, that
Unlock this Answer For Free Now!
View this answer and more for free by performing one of the following actions

Scan the QR code to install the App and get 2 free unlocks

Unlock quizzes for free by uploading documents