The diagram below shows the market demand curve and the cost curves for a single firm. 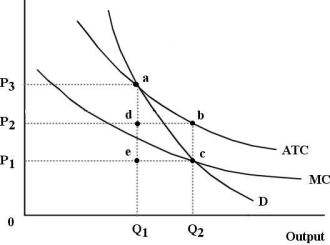 FIGURE 12- 6
-Refer to Figure 12- 6. Suppose this firm is being regulated using a policy of marginal- cost pricing. To maintain the resulting level of output
A) the demand curve would have to shift down.
B) the government would have to accept the allocative inefficiency associated with this level of output.
C) the regulator would have to allow the firm to keep the monopoly profits at this level of output.
D) the government would have to subsidize the firm or it will eventually shut down.
E) the average total cost curve would have to shift up.
Correct Answer:
Verified
Q38: Consumer surplus represents
A) the marginal value that
Q39: Which of the following is an example
Q40: The diagram below shows the market demand
Unlock this Answer For Free Now!
View this answer and more for free by performing one of the following actions

Scan the QR code to install the App and get 2 free unlocks

Unlock quizzes for free by uploading documents