The diagram below shows the demand and supply curves in a perfectly competitive market. 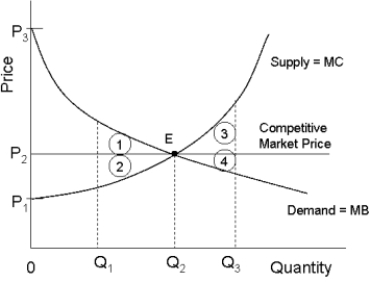 FIGURE 12- 5
-Refer to Figure 12- 5. In the free- market equilibrium, producer plus consumer surplus is maximized and is illustrated by the area
A) 1 + 2 + 3 + 4.
B) P1P3E.
C) 1 + 2.
D) P1P2E.
E) P3P2E.
Correct Answer:
Verified
Q47: Consider two firms, A and B, that
Q48: The larger the minimum efficient scale of
Q49: Traditionally, economists have regarded monopoly as an
Q50: The diagram below shows the demand and
Q51: We can safely say that each point
Q53: The diagram below shows the demand and
Q54: An economy with no market failures and
Q56: The objective of government regulation and competition
Q57: In the absence of market failures, allocative
Q86: Regulation can reduce the profits of a
Unlock this Answer For Free Now!
View this answer and more for free by performing one of the following actions

Scan the QR code to install the App and get 2 free unlocks

Unlock quizzes for free by uploading documents