The diagram below shows the demand and supply curves in a perfectly competitive market. 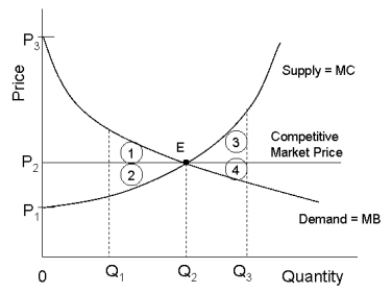 FIGURE 12-5
-Refer to Figure 12-5. Allocative efficiency occurs
A) where the areas 1, 2, 3, and 4 are maximized.
B) at the higher output Q₃.
C) at price P1 and output Q₃.
D) at price P2 and output Q₂.
E) at the lower output Q₁.
Correct Answer:
Verified
Q43: The diagram below shows the market demand
Q44: If an economy is productively inefficient, it
Q46: The administrative agency established to enforce the
Q48: The larger the minimum efficient scale of
Q49: Traditionally, economists have regarded monopoly as an
Q52: The diagram below shows the demand and
Q56: The objective of government regulation and competition
Q57: In the absence of market failures, allocative
Q59: A major aim of Canadian competition policy
Q63: Consider the case of a natural monopoly
Unlock this Answer For Free Now!
View this answer and more for free by performing one of the following actions

Scan the QR code to install the App and get 2 free unlocks

Unlock quizzes for free by uploading documents