The diagram below shows the market demand curve and the cost curves for a single firm. 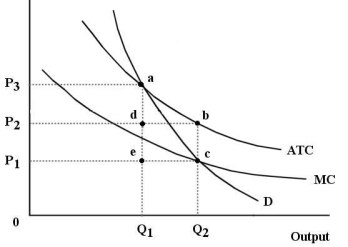 FIGURE 12-6
-Refer to Figure 12-3. If the diagram depicts a perfectly competitive industry, the equilibrium price and quantity is
A) P3 and Q₁.
B) P1 and Q₁.
C) P1 and Q₂.
D) P2 and Q₁.
E) P2 and Q₂.
Correct Answer:
Verified
Q45: Productive efficiency (at the level of the
Q48: The larger the minimum efficient scale of
Q54: An economy with no market failures and
Q59: The diagram below shows the demand and
Q70: Consider two firms, A and B, that
Q77: A natural monopoly exists when
A) a firm
Q80: The Canadian economy is achieving allocative efficiency
Q94: At the level of the industry, the
Q96: Allocative efficiency is actively sought
A) only by
Q99: The diagram below shows cost and revenue
Unlock this Answer For Free Now!
View this answer and more for free by performing one of the following actions

Scan the QR code to install the App and get 2 free unlocks

Unlock quizzes for free by uploading documents