The diagram below shows cost and revenue curves for a natural monopoly producing electricity. Price is dollars per kilowatt hour and quantity is kilowatt hours per day. 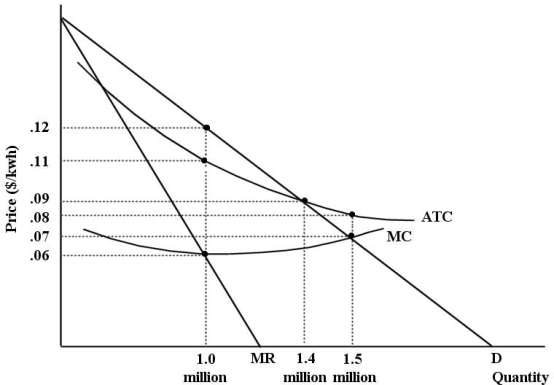 FIGURE 12- 7
-Refer to Figure 12- 7. Suppose this firm is being regulated using a pricing policy of average- cost pricing. In this case, economic profits are equal to
A) $0.
B) $10 000.
C) $6000.
D) $126 000.
E) $28 000.
Correct Answer:
Verified
Q94: At the level of the industry, the
Q95: The diagram below shows supply, demand, and
Q96: Allocative efficiency is actively sought
A) only by
Q97: Prior to the 1986 amendments to the
Q98: Consider three firms, A, B and C,
Q100: The diagram below shows the market demand
Q101: The diagram below shows the market demand
Q102: A natural monopoly
A) generally needs to be
Q103: If all firms are profit maximizers, then
Q104: If a regulatory agency ordered a public
Unlock this Answer For Free Now!
View this answer and more for free by performing one of the following actions

Scan the QR code to install the App and get 2 free unlocks

Unlock quizzes for free by uploading documents