The diagram below shows the market demand curve and the cost curves for a single firm. 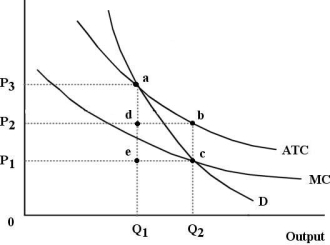 FIGURE 12- 6
-Refer to Figure 12- 6. The firm depicted in the figure is
A) an oligopoly.
B) a perfectly competitive firm.
C) a natural monopoly.
D) a monopolistically competitive firm.
E) a cartel.
Correct Answer:
Verified
Q99: The diagram below shows cost and revenue
Q100: The diagram below shows the market demand
Q101: The diagram below shows the market demand
Q102: A natural monopoly
A) generally needs to be
Q103: If all firms are profit maximizers, then
Q104: If a regulatory agency ordered a public
Unlock this Answer For Free Now!
View this answer and more for free by performing one of the following actions

Scan the QR code to install the App and get 2 free unlocks

Unlock quizzes for free by uploading documents