The diagram below shows the market demand curve and the cost curves for a single firm. 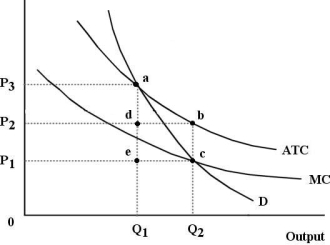 FIGURE 12- 6
-Refer to Figure 12- 6. Suppose this firm is being regulated using a policy of average- cost pricing. In this case,
A) the result is as close to the competitive outcome as possible.
B) the result is allocatively efficient because economic profits are zero.
C) the result is allocatively inefficient because price exceeds marginal cost.
D) the result is allocatively inefficient because the marginal cost curve is downward sloping.
E) the level of output is too low, but the price is allocatively efficient.
Correct Answer:
Verified
Q96: Allocative efficiency is actively sought
A) only by
Q97: Prior to the 1986 amendments to the
Q98: Consider three firms, A, B and C,
Q99: The diagram below shows cost and revenue
Q100: The diagram below shows the market demand
Q102: A natural monopoly
A) generally needs to be
Q103: If all firms are profit maximizers, then
Q104: If a regulatory agency ordered a public
Unlock this Answer For Free Now!
View this answer and more for free by performing one of the following actions

Scan the QR code to install the App and get 2 free unlocks

Unlock quizzes for free by uploading documents