The diagram below shows a pharmaceutical firm's demand curve and marginal cost curve for a new heart medication for which the firm holds a 20-year patent on its production. 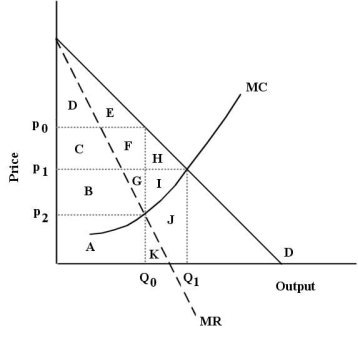 FIGURE 10-5
-Refer to Figure 10-5. Assume this pharmaceutical firm charges a single price for its drug. At its profit-maximizing level of output it will produce
A) Q0 units and charge a price of p0.
B) Q₁ units and charge a price of p1.
C) Q0 units and charge a price of p2.
D) Q₁ units and charge a price greater than its average total variable cost.
E) Q0 units and charge the perfectly competitive price.
Correct Answer:
Verified
Q1: One similarity between a monopolist and a
Q4: At the profit- maximizing level of output
Q6: A number of firms agreeing together to
Q8: If a monopolist is practicing perfect price
Q9: Which one of the following is a
Q11: The diagram below shows total revenue for
Q16: The diagram below shows a pharmaceutical firm's
Q18: Consider a monopolist that is able to
Q19: Suppose that a single-price monopolist knows the
Q30: If a monopolist is practising perfect price
Unlock this Answer For Free Now!
View this answer and more for free by performing one of the following actions

Scan the QR code to install the App and get 2 free unlocks

Unlock quizzes for free by uploading documents