The figure below shows the demand schedule and demand curve for a product produced by a single-price monopolist. 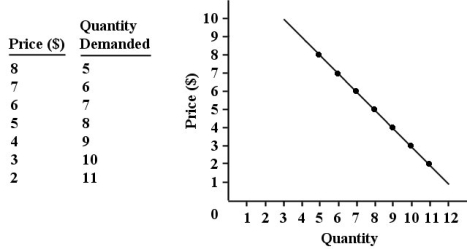 FIGURE 10-1
-Refer to Figure 10-1.
A) 34; 28; -6
B) 9; 3; -6
C) 40; 27; -13
D) 3; 9; 6
E) 30; 36; 6
Correct Answer:
Verified
Q5: One of the reasons cartels are considered
Q21: A monopolist is currently producing an output
Q24: Suppose all of the firms in a
Q25: A cartel can only succeed in the
Q34: It is common for a cartel to
Q41: For a single- price monopolist, marginal revenue
Q45: Which of the following statements about a
Q47: One similarity between a monopoly and a
Q49: The diagram below shows a pharmaceutical firm's
Q50: Price discrimination, if possible, allows a price-
Unlock this Answer For Free Now!
View this answer and more for free by performing one of the following actions

Scan the QR code to install the App and get 2 free unlocks

Unlock quizzes for free by uploading documents