The figure below shows the demand schedule and demand curve for a product produced by a single-price monopolist. 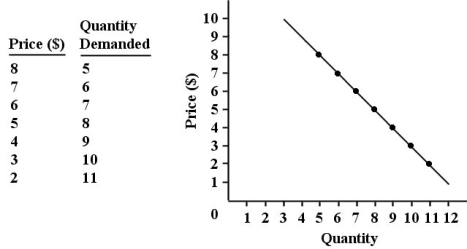 FIGURE 10-1
-Refer to Figure 10-1. Suppose this single-price monopolist is initially selling 5 units at $8 each and then reduces the price of the product to $6.
A) 10; 12; 2
B) 8; 6; 2
C) 38; 40; 2
D) 5; 7; -2
E) 14; 14; 0
Correct Answer:
Verified
Q29: The diagram below shows a pharmaceutical firm's
Q31: With regard to price discrimination, we can
Q33: One reason movie theatres charge a lower
Q35: Natural barriers to entry include
A) a patent
Q42: If an industry's demand conditions allow at
Q51: If a monopolist's marginal revenue is MR
Q59: The diagram below shows a pharmaceutical firm's
Q60: Suppose a monopolist faces the demand curve
Q73: For a monopolist, the profit- maximizing level
Q76: Suppose the market for some product can
Unlock this Answer For Free Now!
View this answer and more for free by performing one of the following actions

Scan the QR code to install the App and get 2 free unlocks

Unlock quizzes for free by uploading documents