The diagram below shows a pharmaceutical firm's demand curve and marginal cost curve for a new heart medication for which the firm holds a 20- year patent on its production. 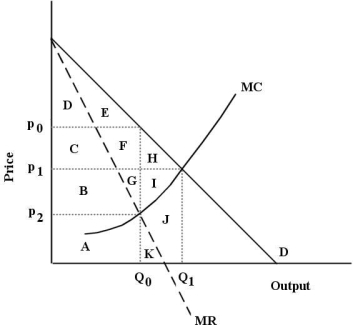 FIGURE 10- 5
-Refer to Figure 10- 5. Suppose this pharmaceutical firm is charging a single price for its drug and is maximizing its profits. If it then begins to perfectly price discriminate among its buyers it will
A) reduce its producer surplus by areas C+F+H.
B) decrease its total output.
C) no longer be equating MR and MC.
D) capture consumer surplus equal to areas D+E+C+F+H.
E) cause a loss of economic surplus to society as a whole.
Correct Answer:
Verified
Q91: If a competing firm is able to
Q92: A single- price monopolist is currently producing
Q93: Consider the following AR and MR curves
Q94: Suppose a monopolist faces the demand curve
Q95: A likely cause of a natural monopoly
Q97: Suppose the technology of an industry is
Q98: The diagram below shows a pharmaceutical firm's
Q99: The marginal revenue curve facing a single-
Q100: Which of the following statements about single-
Q101: Suppose that a single- price monopolist
Unlock this Answer For Free Now!
View this answer and more for free by performing one of the following actions

Scan the QR code to install the App and get 2 free unlocks

Unlock quizzes for free by uploading documents