The diagram below shows two production possibilities boundaries for Country X. 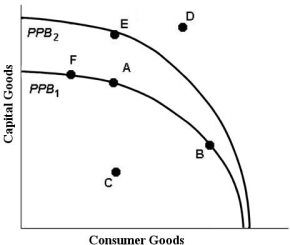 FIGURE 1- 3
-Refer to Figure 1- 3. Growth in the country's productive capacity is illustrated by
A) a movement from a point inside the boundary such as C to the boundary.
B) the movement between points on a given boundary.
C) a point like D outside the boundary.
D) a single point such as A on the boundary.
E) an outward shift of the boundary, for example from PPB1 to PPB2.
Correct Answer:
Verified
Q15: Consider a production possibilities boundary showing the
Q25: Suppose fire destroy many millions of hectares
Q27: Suppose there are only two goods produced
Q30: If there is always a three- for-
Q32: Economics is generally NOT concerned with
A)restricting the
Q37: The table below illustrates that, in
Q37: In mixed economies, economic behaviour is
A)based primarily
Q38: The diagram below shows two production possibilities
Q41: The diagram below shows two production possibilities
Q44: The downward- sloping line in the diagram
Unlock this Answer For Free Now!
View this answer and more for free by performing one of the following actions

Scan the QR code to install the App and get 2 free unlocks

Unlock quizzes for free by uploading documents