The downward- sloping line in the diagram below shows the combinations of health care and education expenditures that the government can afford with a given amount of tax revenue. 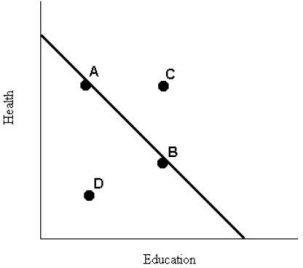 FIGURE 1- 5
-Refer to Figure 1- 5. The levels of health and education expenditures at point C
A) are equal to those of point A and point B.
B) are less than at point D.
C) could be achieved if the prices of health and/or education increased.
D) are more cost- effective than those at points A, B, and D.
E) are not attainable with the government's current budget.
Correct Answer:
Verified
Q46: An economic system that relies primarily upon
Q47: Which of the following has most contributed
Q48: Suppose there are three alternatives to attending
Q50: Behaviour in free- market economies is
A)determined by
Q51: Consider the following list: a worker with
Q52: The opportunity cost of going to college
Q53: In the circular flow of income, the
Q54: Economists usually assume that households
A)make consistent decisions,
Q57: On a diagram of a production possibilities
Q58: Scarcity is likely to be
A)a problem that
Unlock this Answer For Free Now!
View this answer and more for free by performing one of the following actions

Scan the QR code to install the App and get 2 free unlocks

Unlock quizzes for free by uploading documents