The diagram below shows two production possibilities boundaries for Country X. 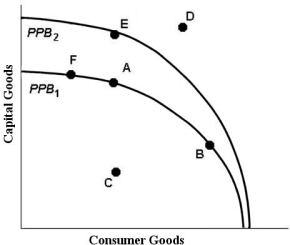 FIGURE 1- 3
-Refer to Figure 1- 3. That the production possibilities boundaries are drawn concave to the origin reflects the
A) unfair distribution of resources in the economy.
B) constant opportunity cost of producing more of either good.
C) decreasing opportunity cost of producing more of either good.
D) increasing opportunity cost of producing more of either good.
E) scarcity of resources in the economy.
Correct Answer:
Verified
Q61: Specialization of labour led to greater efficiency
Q62: Specialization of labour means that
A)job security is
Q65: It has been observed that university enrollment
Q69: In traditional economies, economic behaviour is
A)based primarily
Q70: Labour services are bought and sold in
Q74: Suppose a scientific breakthrough leads to a
Q76: The barter system of exchange is inefficient
Q86: With a budget of $200 million, the
Q90: The table below shows that, in
Q91: The table below illustrates that, in
Unlock this Answer For Free Now!
View this answer and more for free by performing one of the following actions

Scan the QR code to install the App and get 2 free unlocks

Unlock quizzes for free by uploading documents