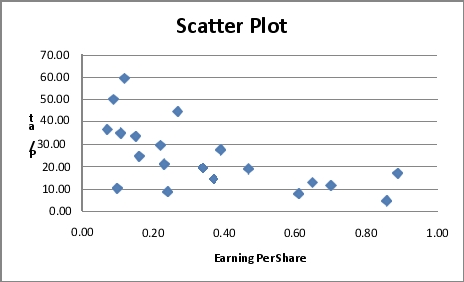
Given below is the scatter plot of the price/earnings ratio versus earnings per share of 20 U.S.companies.There appear to be a positive relationship between price/earnings ratio and earnings per share.
Correct Answer:
Verified
Q172: Given below is the scatter plot of
Q173: The addition of visual elements that either
Q174: SCENARIO 2-18
The stem-and-leaf display below shows the
Q175: Given below is the scatter plot of
Q176: SCENARIO 2-18
The stem-and-leaf display below shows the
Q178: SCENARIO 2-18
The stem-and-leaf display below shows the
Q179: The Guidelines for Developing Visualizations recommend labeling
Q180: The Guidelines for Developing Visualizations recommend using
Q181: A multidimensional contingency table allows you to
Q182: The Guidelines for Developing Visualizations recommend always
Unlock this Answer For Free Now!
View this answer and more for free by performing one of the following actions

Scan the QR code to install the App and get 2 free unlocks

Unlock quizzes for free by uploading documents