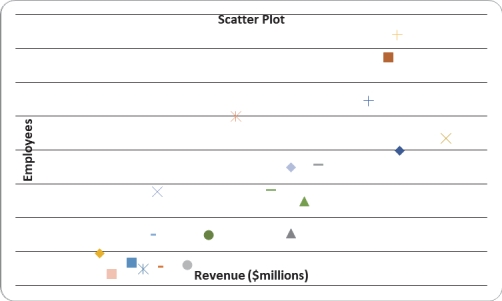
Given below is the scatter plot of the number of employees and the total revenue ($millions)of 20 U.S.companies.There appears to be a positive relationship between total revenue and the number of employees.
Correct Answer:
Verified
Q156: SCENARIO 2-14
The table below contains the
Q157: SCENARIO 2-14
The table below contains the
Q158: SCENARIO 2-14
The table below contains the
Q159: SCENARIO 2-14
The table below contains the
Q160: SCENARIO 2-14
The table below contains the
Q162: SCENARIO 2-18
The stem-and-leaf display below shows the
Q163: The Guidelines for Developing Visualizations recommend avoiding
Q164: Given below is the scatter plot of
Q165: SCENARIO 2-17
The following table presents total retail
Q166: Given below is the scatter plot of
Unlock this Answer For Free Now!
View this answer and more for free by performing one of the following actions

Scan the QR code to install the App and get 2 free unlocks

Unlock quizzes for free by uploading documents