SCENARIO 17-3
The tree diagram below shows the results of the classification tree model that has been constructed to predict the probability of a cable company's customers who will switch ("Yes" or "No")into its bundled program offering based on the price ($30,$40,$50,$60)and whether the customer spends more than 5 hours a day watching TV ("Yes" or "No")using the data set of 100 customers collected from a survey.

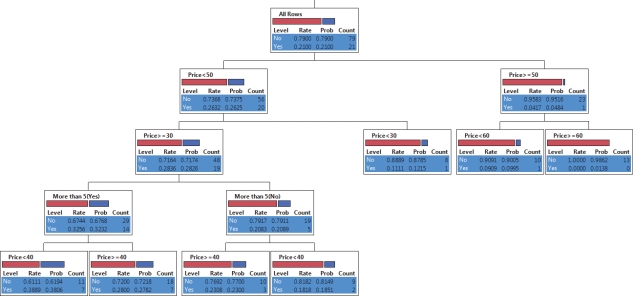
-Referring to Scenario 17-3,what is the highest rate of switching into the bundled offering?
Correct Answer:
Verified
Q49: Successful implementation of a regression tree requires
Q50: Splitting of a node might be followed
Q51: The result of the regression tree is
Q52: SCENARIO 17-3
The tree diagram below shows the
Q53: Splitting is always followed by pruning in
Q55: The G 2
statistic is a measure of
Q56: Successful implementation of a classification tree requires
Q57: SCENARIO 17-3
The tree diagram below shows the
Q58: Successful use of a regression tree requires
Q59: SCENARIO 17-3
The tree diagram below shows the
Unlock this Answer For Free Now!
View this answer and more for free by performing one of the following actions

Scan the QR code to install the App and get 2 free unlocks

Unlock quizzes for free by uploading documents