A survey of 800 college seniors resulted in the following crosstabulation regarding their undergraduate major and whether or not they plan to go to graduate school. 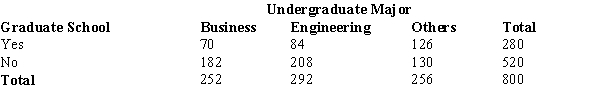 The above crosstabulation shows
A) frequencies.
B) row percentages.
C) column percentages.
D) overall percentages.
Correct Answer:
Verified
Q43: A graphical device for depicting categorical data
Q54: A graphical tool typically associated with the
Q56: Data that indicate how much or how
Q57: In a stem-and-leaf display,
A) a single digit
Q61: The numbers of hours worked (per week)
Q62: A sample of 15 children shows their
Q63: A display used to compare the frequency,
Q64: A sample of 15 children shows their
Q65: A survey of 800 college seniors resulted
Q67: Histograms based on data on housing prices
Unlock this Answer For Free Now!
View this answer and more for free by performing one of the following actions

Scan the QR code to install the App and get 2 free unlocks

Unlock quizzes for free by uploading documents