The figure given below depicts the IS-LM-FE model with floating exchange rates. 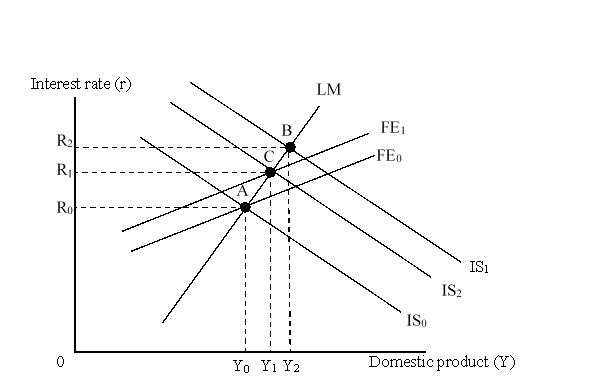 The shift of the IS curve from IS1 to IS2 was caused by:
A) a contractionary monetary policy.
B) official intervention in the foreign exchange market.
C) an improvement in current account position.
D) a worsening of international price competitiveness.
Correct Answer:
Verified
Q23: With floating exchange rates, expansionary fiscal policy
Q24: At which of the following did the
Q25: For a country with a floating exchange
Q26: Under a floating exchange rate regime, in
Q27: Which of the following statements is true?
A)Monetary
Q29: Everything else remaining unchanged, the effect of
Q30: If there is a shift of international
Q31: Under a floating exchange rate regime, following
Q32: The figure given below depicts the IS-LM-FE
Q33: Which of the following is a possible
Unlock this Answer For Free Now!
View this answer and more for free by performing one of the following actions

Scan the QR code to install the App and get 2 free unlocks

Unlock quizzes for free by uploading documents