The figure given below illustrates the market for British pounds. D£ and S£ are the demand and supply curves of the British pounds respectively. 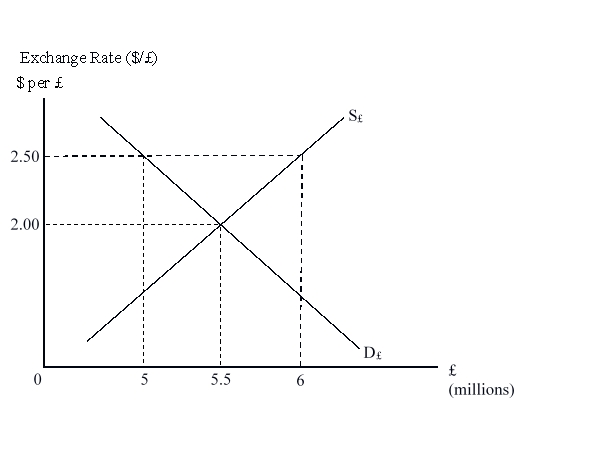 Suppose initially the exchange rate is pegged at $2.50 per pound. If the governments allow the pound to float, the pound will experience a(n) :
A) surplus.
B) buoyant period.
C) appreciation.
D) depreciation.
Correct Answer:
Verified
Q21: Which of the following best characterizes the
Q22: Exchange rates are equalized in different locations
Q23: Under a floating exchange rate system, the
Q24: Under a floating exchange rate system, an
Q25: Under the floating exchange rate system, a
Q27: The figure given below illustrates the market
Q28: Other things remaining unchanged, if American exports
Q29: In a _ exchange rate system the
Q30: The figure given below illustrates the market
Q31: Which of the following groups is most
Unlock this Answer For Free Now!
View this answer and more for free by performing one of the following actions

Scan the QR code to install the App and get 2 free unlocks

Unlock quizzes for free by uploading documents