The figure given below shows a situation where the producers of good X are forming an international cartel. Here, MR = Marginal Revenue, MC = Marginal Cost, and P = Price. The cartel use monopoly pricing for its output. 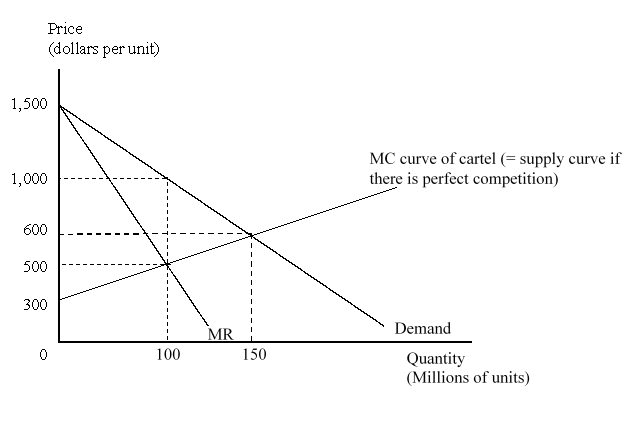 A declining market share of the cartel would lead to a:
A) rightward shift of the cartel marginal cost curve and a rise in cartel output.
B) rightward shift of the cartel demand curve and a fall in output.
C) leftward shift of the cartel marginal cost curve and a rise in output.
D) leftward shift of the cartel demand curve and a fall in cartel output.
Correct Answer:
Verified
Q16: While developing countries have over _ of
Q17: Which of the following was the main
Q18: Suppose country A is a major exporter
Q19: The world prices of the primary products
Q20: Which of the following, if happens, may
Q22: Which of the following increases the speed
Q23: Given the limits of international cartel power,
Q24: Cartel power is weakened by the tendency
Q25: The figure given below shows a situation
Q26: Studies comparing growth rates of countries practicing
Unlock this Answer For Free Now!
View this answer and more for free by performing one of the following actions

Scan the QR code to install the App and get 2 free unlocks

Unlock quizzes for free by uploading documents