The figure given below shows the U.S. market for imported wine. For simplicity, we consider export supply curves to be flat. Chilean wine is available for $480 per barrel and French wine is available for $420 per barrel. 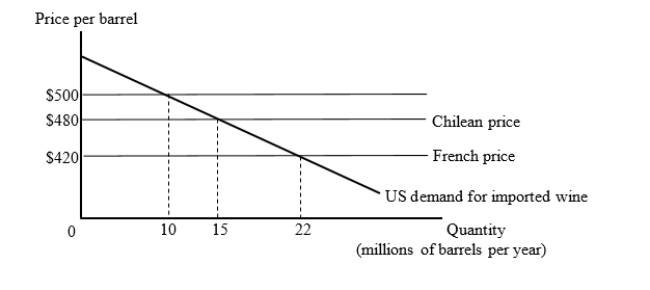 Suppose the United States has a tariff of $80 per barrel on imported wine. Then, the United States joins a trade bloc with Chile. Calculate the loss suffered by the U.S. arising from the shift of trade from low-cost exporters to higher-cost bloc-partner exporter.
A) $50 million
B) $250 million
C) $600 million
D) $800 million
Correct Answer:
Verified
Q3: The figure given below shows the U.S.
Q4: Which of the following allows member countries
Q5: The figure given below shows the U.S.
Q6: Which of the following is on a
Q7: Which of the following features does a
Q9: The figure given below shows the U.S.
Q10: Which of the following states that any
Q11: The Southern Common Market (MERCOSUR) is actually
Q12: The NAFTA is an example of a(n):
A)free-trade
Q13: The figure given below shows the U.S.
Unlock this Answer For Free Now!
View this answer and more for free by performing one of the following actions

Scan the QR code to install the App and get 2 free unlocks

Unlock quizzes for free by uploading documents