The figures given below illustrate a situation of a trade embargo. In Figure (a) Dd and Sd are the domestic demand and supply curves of the embargoing countries. The import price is P0 and the target country imports the amount Q0 before the embargo is imposed. 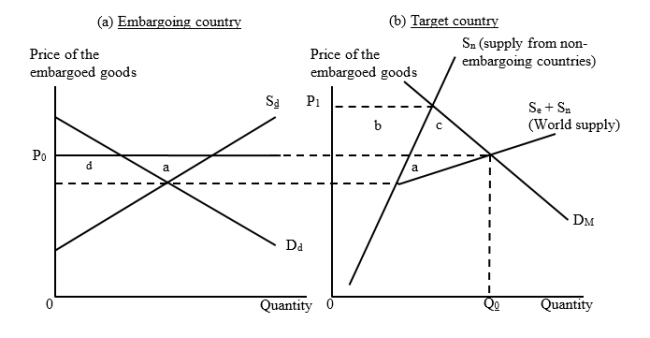 The embargo initiator(s) lose area _____ while the target country loses _____.
A) (b + c) ; (a + c)
B) (a + d) ; (b + c)
C) a; b
D) a; (b + c)
Correct Answer:
Verified
Q25: The figure given below shows the U.S.
Q26: The gains from trade creation is likely
Q27: An economic failure of an embargo is
Q28: Which of the following identifies an important
Q29: Embargoes are likely to be effective when:
A)the
Q31: Which countries joined the European Union in
Q32: _ determine(s) which products have been produced
Q33: The net loss from trade diversion for
Q34: A political failure of a trade embargo
Q35: Which of the following was an observable
Unlock this Answer For Free Now!
View this answer and more for free by performing one of the following actions

Scan the QR code to install the App and get 2 free unlocks

Unlock quizzes for free by uploading documents