The figure given below shows the market for MP3 players in a small country. Dd and Sd are the domestic demand and domestic supply curves of the MP3 players before the imposition of the quota. (Sd + QQ) is the total available domestic supply curve after the quota has been imposed. According to the figure, if import licenses are allocated based on a resource-using procedure, the loss to the economy will be: 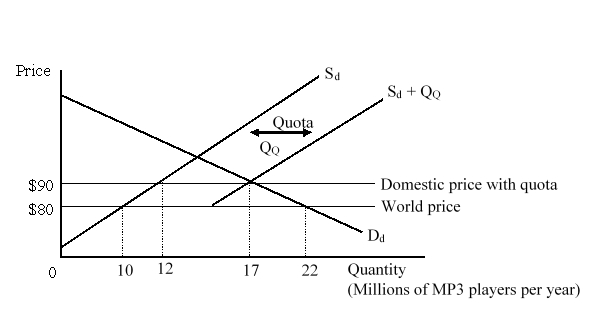
A) $35 million.
B) less than $10 million.
C) greater than $35 million.
D) $25 million.
Correct Answer:
Verified
Q12: A small country imports T-shirts. With free
Q13: Which of the following is true of
Q14: A small country imports T-shirts. With free
Q15: Under which of the following situations will
Q16: A small country imports T-shirts. With free
Q18: One of the reasons that protectionists and
Q19: Which of the following is a means
Q20: The figure given below shows the market
Q21: Which of the following mandates that an
Q22: Which of the following is NOT true
Unlock this Answer For Free Now!
View this answer and more for free by performing one of the following actions

Scan the QR code to install the App and get 2 free unlocks

Unlock quizzes for free by uploading documents