The figure given below shows the market for MP3 players in a small country. Dd and Sd are the domestic demand and domestic supply curves of the MP3 players before the imposition of the quota. (Sd + QQ) is the total available domestic supply curve after the quota has been imposed. Referring to the figure, if instead of using a quota to limit imports they were limited by a voluntary export restraint (VER) , the loss to the nation would be: 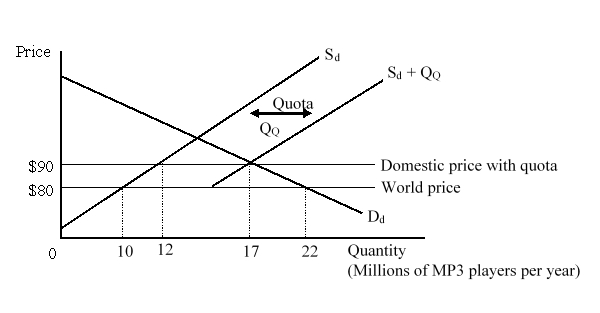
A) $35 million.
B) $50 million.
C) $85 million.
D) $195 million.
Correct Answer:
Verified
Q1: The figure given below shows the market
Q2: A small country imports T-shirts. With free
Q3: In the case of a small country,
Q4: The figure given below shows the market
Q6: The figure given below shows the market
Q7: The figure given below shows the market
Q8: A small country imports T-shirts. With free
Q9: A small country imports T-shirts. With free
Q10: Which of the following is NOT true
Q11: Restricting imports into a small country by
Unlock this Answer For Free Now!
View this answer and more for free by performing one of the following actions

Scan the QR code to install the App and get 2 free unlocks

Unlock quizzes for free by uploading documents