The figure given below shows the domestic demand (Dd) and supply (Sd) curves of mopeds in a country before an import quota is imposed by the government. After the imposition of quota, the total available supply curve becomes Sd + QQ. 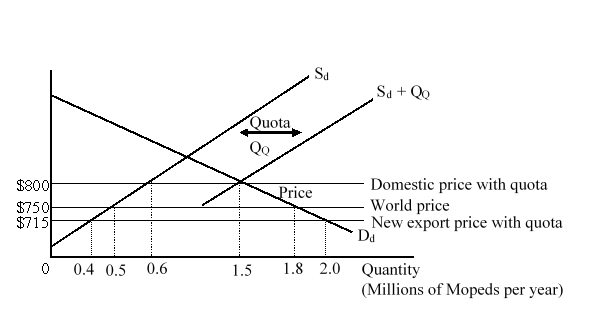 After the quota is imposed by the government, the domestic producers:
A) lose $2.5 million.
B) gain $27.5 million.
C) gain $42.5 million.
D) lose $80 million.
Correct Answer:
Verified
Q24: The Buy America Act of 1933 mandates
Q25: With a voluntary export restraint (VER), the
Q26: Which of the following NTBs may generate
Q27: The figure given below shows the domestic
Q28: In which of the following cases does
Q30: A domestic monopoly producing a close substitute
Q31: The figure given below shows the domestic
Q32: Suppose a small country sets all of
Q33: What is the percent reduction in import
Q34: The figure given below shows the domestic
Unlock this Answer For Free Now!
View this answer and more for free by performing one of the following actions

Scan the QR code to install the App and get 2 free unlocks

Unlock quizzes for free by uploading documents