The figure given below shows the market for shoes in the U.S. The domestic price line with tariff lies above the international price line. Dd and Sd are the domestic demand and supply curves of shoes respectively. 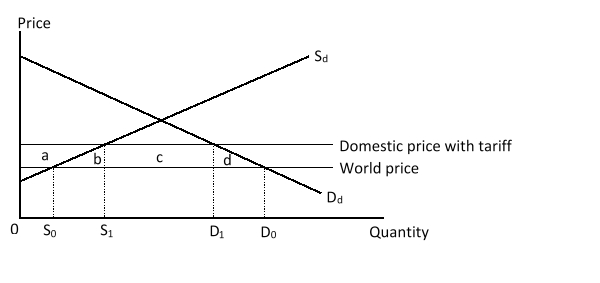 The imposition of a tariff on shoes caused economic welfare in the U.S. to _____ by an amount measured by the area _____.
A) fall; c
B) fall; (b + d)
C) rise; (b + c+ d)
D) rise; (a + c)
Correct Answer:
Verified
Q1: Which of the following correctly identifies the
Q2: The figure given below shows the market
Q3: The figure given below shows the market
Q5: The figure given below shows the market
Q6: The figure given below shows the market
Q7: If a small country imposes a tariff
Q8: The figure given below shows the market
Q9: The figure given below shows the market
Q10: The figure given below shows the market
Q11: Which of the following refers to the
Unlock this Answer For Free Now!
View this answer and more for free by performing one of the following actions

Scan the QR code to install the App and get 2 free unlocks

Unlock quizzes for free by uploading documents