The figure given below shows a shift in the production-possibility curve of a country from AB to AC. Here, S1 and C1 are the initial production and consumption points respectively. S2 and C2, on the other hand, are the final production and consumption points respectively. The shifts shown in the given figure indicate that: 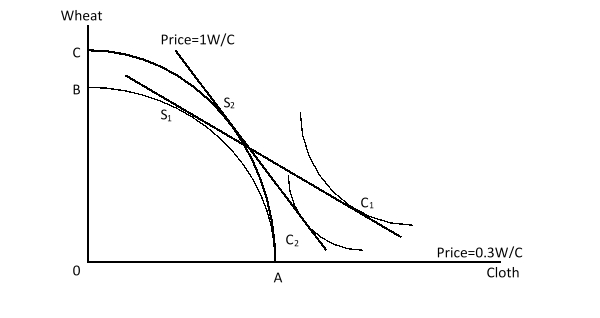
A) the domestic demand for wheat is higher than the demand in the international market.
B) the country can now consume more of both goods.
C) the world price of wheat has increased.
D) the terms of trade for this country have deteriorated.
Correct Answer:
Verified
Q30: Immiserizing growth is most likely to occur
Q31: Countries that are open to international trade:
A)cannot
Q32: Which of the following refers to individual
Q33: Technology-based comparative advantage:
A)can help explain how the
Q34: Large countries are _ susceptible to immiserizing
Q36: In Heckscher-Ohlin theory, differences in _ across
Q37: Which of the following is most unlikely
Q38: _ first presented the product cycle hypothesis.
A)Adam
Q39: Which of the following conditions is NOT
Q40: When economic growth in a large country
Unlock this Answer For Free Now!
View this answer and more for free by performing one of the following actions

Scan the QR code to install the App and get 2 free unlocks

Unlock quizzes for free by uploading documents