The figure given below shows the production possibility curves for Canada (AB) and the Rest of the World (CD) . The opportunity cost of producing a bushel of corn in Canada and in the Rest of the World are _____ liters and _____ liters of maple syrup respectively. 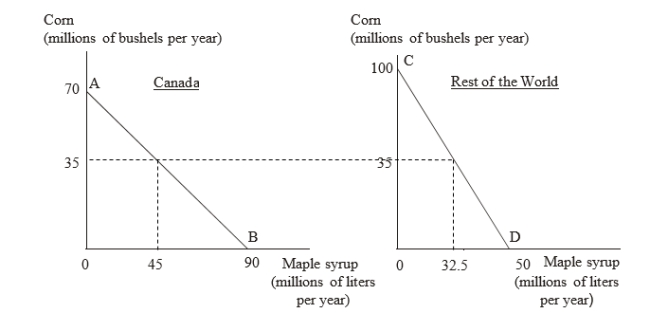
A) 9/7; 2
B) 7/9; 2
C) 9/7; 1/2
D) 7/9; 1/2
Correct Answer:
Verified
Q18: According to the Mercantilists, governments should:
A)subsidize and
Q19: Labor productivity refers to:
A)the number of units
Q20: The table given below shows the
Q21: Which of the following is NOT true
Q22: The table given below shows the
Q24: The table given below shows the
Q25: The table given below shows the
Q26: The table given below shows the
Q27: The table given below shows the
Q28: Which of the following is true of
Unlock this Answer For Free Now!
View this answer and more for free by performing one of the following actions

Scan the QR code to install the App and get 2 free unlocks

Unlock quizzes for free by uploading documents