The figure given below shows the production possibility curves for Canada (AB) and the Rest of the World (CD) . The opportunity cost of producing one liter of maple syrup in Canada and in the Rest of the World are _____ bushels and _____ bushels of corn respectively. 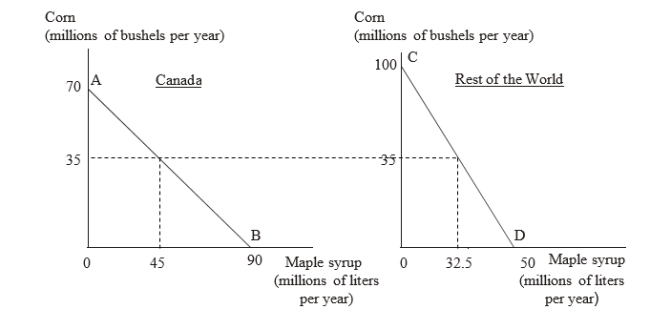
A) 9/7; 2
B) 7/9; 2
C) 9/7; 1/2
D) 7/9; 1/2
Correct Answer:
Verified
Q25: The table given below shows the
Q26: The table given below shows the
Q27: The table given below shows the
Q28: Which of the following is true of
Q29: The table given below shows the
Q31: The table given below shows the
Q32: The table given below shows the
Q33: The table given below shows the
Q34: The table given below shows the
Q35: Vintland and Moonited Republic produce wine and
Unlock this Answer For Free Now!
View this answer and more for free by performing one of the following actions

Scan the QR code to install the App and get 2 free unlocks

Unlock quizzes for free by uploading documents