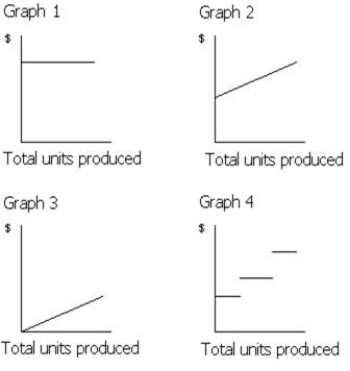
-Which of the graphs in Figure 21-1 illustrates the behavior of a total fixed cost?
A) Graph 2
B) Graph 3
C) Graph 4
D) Graph 1
Correct Answer:
Verified
Q56: Assuming no other changes, operating income will
Q57: If the volume of sales is $7,000,000
Q58: The adoption of variable costing for managerial
Q59: Absorption costing is required for financial reporting
Q60: Only a single line, which represents the
Q62: Costs that remain constant in total dollar
Q63: Which of the following is not an
Q64: Which of the following is not an
Q65: A cost that has characteristics of both
Q66: Which of the following is an example
Unlock this Answer For Free Now!
View this answer and more for free by performing one of the following actions

Scan the QR code to install the App and get 2 free unlocks

Unlock quizzes for free by uploading documents