The quarterly sales of a company (in millions of dollars) over the past three years are given in the following table. 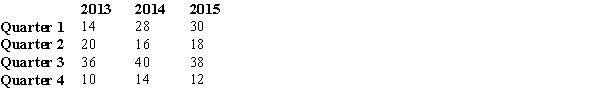
a.
Compute the four seasonal indexes.
b.
The trend for these data is Trend = 20.82 + .336t (t represents time, where t = 1 for Quarter 1 of 2013 and t = 12 for Quarter 4 of 2015). Forecast sales for the first quarter of 2016 using the trend only.
c.
Forecast sales for the first quarter of 2016 using the trend and seasonal indexes and write your answer below.
Correct Answer:
Verified
b.
$25....
View Answer
Unlock this answer now
Get Access to more Verified Answers free of charge
Q36: Gradual shifting or movement of a time
Q37: The model that assumes that the actual
Q38: All of the following are true about
Q39: The forecasting method that is appropriate when
Q40: A parameter of the exponential smoothing model
Q42: Which of the following exponential smoothing constant
Q43: Actual sales for January through April are
Q44: The quarterly sales of a company (in
Q45: For the following time series data, using
Q46: Using a naive forecasting method, the forecast
Unlock this Answer For Free Now!
View this answer and more for free by performing one of the following actions

Scan the QR code to install the App and get 2 free unlocks

Unlock quizzes for free by uploading documents