The table below gives beverage preferences for random samples of teens and adults. 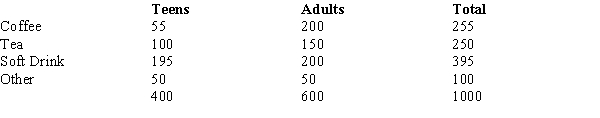 We are asked to test for independence between age (i.e., adult and teen) and drink preferences. The expected number of adults who prefer coffee is
A) 153.
B) 255.
C) 150.
D) 200.
Correct Answer:
Verified
Q16: When individuals in a sample of 150
Q17: A statistical test conducted to determine whether
Q18: Last school year, the student body of
Q19: The number of degrees of freedom associated
Q20: When individuals in a sample of 150
Q22: The following table shows the number of
Q23: You want to test whether or not
Q24: The owner of a car wash wants
Q25: The owner of a car wash wants
Q26: The owner of a car wash wants
Unlock this Answer For Free Now!
View this answer and more for free by performing one of the following actions

Scan the QR code to install the App and get 2 free unlocks

Unlock quizzes for free by uploading documents