The table below gives beverage preferences for random samples of teens and adults. 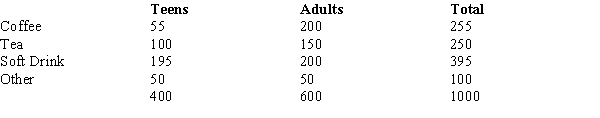 We are asked to test for independence between age (i.e., adult and teen) and drink preferences. The test statistic for this test of independence is
A) 0.
B) 8.4.
C) 62.5.
D) 54.7.
Correct Answer:
Verified
Q33: In the past, 35% of the students
Q34: In the past, 35% of the students
Q35: In the past, 35% of the students
Q36: The following table shows the number of
Q37: You want to test whether or not
Q39: The owner of a car wash wants
Q40: In the past, 35% of the students
Q41: The properties of a multinomial experiment include
Q42: The number of emergency calls per day
Q43: The number of categorical outcomes per trial
Unlock this Answer For Free Now!
View this answer and more for free by performing one of the following actions

Scan the QR code to install the App and get 2 free unlocks

Unlock quizzes for free by uploading documents