A survey of 800 college seniors resulted in the following crosstabulation regarding their undergraduate major and whether or not they plan to go to graduate school. 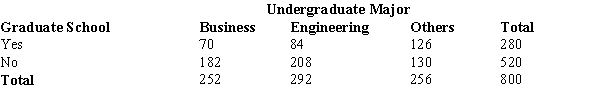 The above crosstabulation shows
A) frequencies.
B) row percentages.
C) column percentages.
D) overall percentages.
Correct Answer:
Verified
Q56: Data that indicate how much or how
Q57: In a stem-and-leaf display,
A) a single digit
Q58: In quality control applications, bar charts are
Q59: A researcher is gathering data from four
Q60: Which of the following is least useful
Q62: The numbers of hours worked (per week)
Q63: A display used to compare the frequency,
Q64: A survey of 800 college seniors resulted
Q65: A sample of 15 children shows their
Q66: A sample of 15 children shows their
Unlock this Answer For Free Now!
View this answer and more for free by performing one of the following actions

Scan the QR code to install the App and get 2 free unlocks

Unlock quizzes for free by uploading documents