Multiple Choice
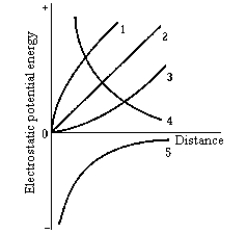 Which of the curves in the graph represents the electrostatic potential energy of a small negative charge plotted as a function of its distance from another positive point charge located at the origin?
A) 1
B) 2
C) 3
D) 4
E) 5
Correct Answer:
Verified
Related Questions

