Multiple Choice
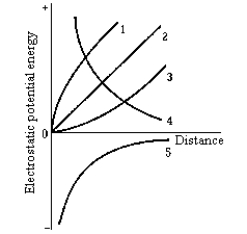 Which of the curves in the graph represents the electrostatic potential energy of a small positive charge plotted as a function of its distance from another positive point charge located at the origin?
A) 1
B) 2
C) 3
D) 4
E) 5
Correct Answer:
Verified
Related Questions
Q6: The voltage between the cathode and the
Q12: Three charges are brought from infinity and
Q13: Q15: The electrostatic potential energy of two protons Unlock this Answer For Free Now! View this answer and more for free by performing one of the following actions Scan the QR code to install the App and get 2 free unlocks Unlock quizzes for free by uploading documents![]()

