Multiple Choice
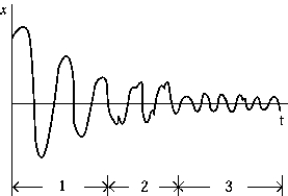 The graph shows the response of a driven oscillatory system as a function of time. The regions) of the graph that shows) the steady-state response isare)
A) 1
B) 2
C) 3
D) 1 and 2
E) 2 and 3
Correct Answer:
Verified
Related Questions
Q89: A physical pendulum oscillates with small amplitude
Q115: Q116: Q117: Q118: Which of the following statements concerning the Q119: A simple harmonic oscillator has angular frequency Q120: A giant simple pendulum has a time Unlock this Answer For Free Now! View this answer and more for free by performing one of the following actions Scan the QR code to install the App and get 2 free unlocks Unlock quizzes for free by uploading documents![]()
![]()
![]()

