The curve shows the position of an object with time. The object moves with a constant speed, v. 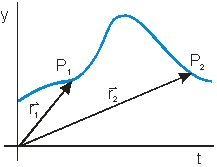 Which of the vector diagrams below best represent the velocity vector at P1 and P2?
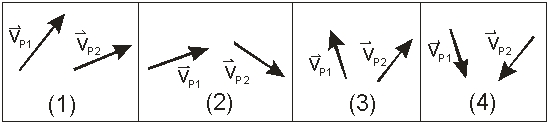
A) 1)
B) 2)
C) 3)
D) 4)
E) None of these is correct.
Correct Answer:
Verified
Q7: A car is traveling east at 50
Q11: You walk 12 km south and then
Q23: A car is at position (x1,y1)= (4
Q57: The curve shows the position of an
Q59: A projectile is fired at an angle
Q61: The figure represents the parabolic trajectory
Q62: Which of the following statements is not
Q63: The maximum horizontal range of a
Q64: The figure represents the parabolic trajectory of
Q65: The figure represents the parabolic trajectory
Unlock this Answer For Free Now!
View this answer and more for free by performing one of the following actions

Scan the QR code to install the App and get 2 free unlocks

Unlock quizzes for free by uploading documents