The motion diagram shows motion an ant moving to the right along a straight line as it is recorded every 1.0 s, starting at point at x = 0.0 cm. Assuming the ant starts from rest, which graph shows ant's position as a function of time? 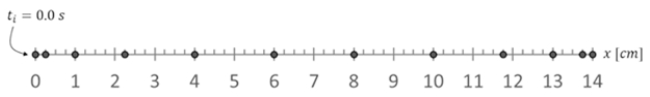
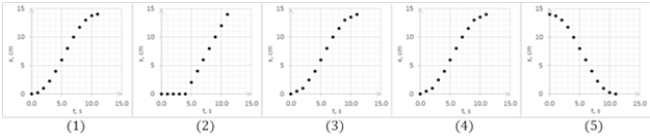
A) 1)
B) 2)
C) 3)
D) 4)
E) 5)
Correct Answer:
Verified
Q1: The motion diagram shows motion an ant
Q3: The displacement of an object during any
Q4: In which graph of v versus t
Q5: A particle moves from x0 = 30
Q7: Four successive displacements of 4 km, 5
Q8: An object, located at the origin when
Q8: If the speed of particle A is
Q11: You drive for 30 min for 30
Q15: A particle moves from x1 = 30
Q17: A particle moves from x1 = -50
Unlock this Answer For Free Now!
View this answer and more for free by performing one of the following actions

Scan the QR code to install the App and get 2 free unlocks

Unlock quizzes for free by uploading documents