In a study of the surface temperatures of vital (living) and non-vital (dead) teeth in a random sample of 32 adults seeking dental care at a university clinic, temperatures of vital and non-vital teeth were measured for each individual. The computer output shown below was generated. 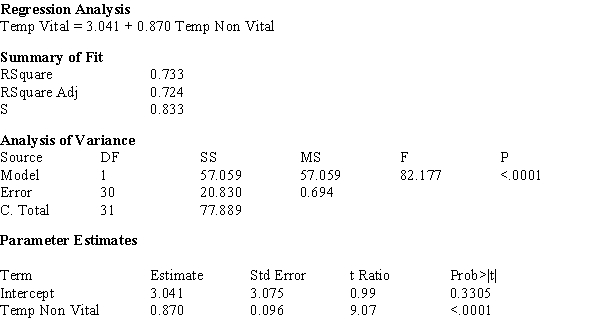
a) What proportion of observed variation in the surface temperature of vital teeth can be explained by the surface temperature of non-vital teeth?
b) Does the simple linear regression model appear to be useful? Justify your response with specific references to the computer output.
c) The estimated standard deviation of a + bx* for x* = 30 is calculated as: sa+b(30) = 0.2417. Calculate a 95% confidence interval for the true average vital tooth temperature when the non-vital tooth temperature is 30 degrees centigrade.
d) In one individual, a single surface temperature for a non-vital tooth is found to be 30 degrees centigrade. Use a 95% prediction interval to predict the resulting temperature of a vital tooth.
Correct Answer:
Verified
b) Yes, since tβ = 9.07 an...
View Answer
Unlock this answer now
Get Access to more Verified Answers free of charge
Q19: A standardized residual plot with spread increasing
Q20: The point estimate a + bx* is
Q21: The scatter plot and residual plot shown
Q22: The computer output given below shows a
Q23: In a random sample of large cities
Q25: The Iowa Tests of Educational Development are
Q26: In a study of gender-typing of toys,
Q27: Let x be the number of pages
Q28: In a forensic study of the relation
Q29: A random sample of steelhead trout was
Unlock this Answer For Free Now!
View this answer and more for free by performing one of the following actions

Scan the QR code to install the App and get 2 free unlocks

Unlock quizzes for free by uploading documents