You will be asked to sketch curves representing the distributions of a set of data, as well as the sampling distributions of the mean under different conditions. You need not get these graphs perfectly correct, but should clearly indicate different aspects of the curves, such as location, variability, and shape. A very large study of college freshmen study habits found that the time (in hours) that freshmen study each week is approximately normal with mean 24 hours and standard deviation 8 hours. Consider random samples of size 16 from the population of freshmen.
a) On the axes below, sketch curves representing the distribution of the original population and the sampling distribution of  for a sample of size n = 16.
b) What is the probability that a sample of size n = 16 from this population would result in a sample mean greater than 30 hours?
c) The study of college freshmen also asked about the students' time spent playing video games, and a relative frequency histogram of the results appears below. The mean amount of time spent playing video games was 0.8 hours per week. 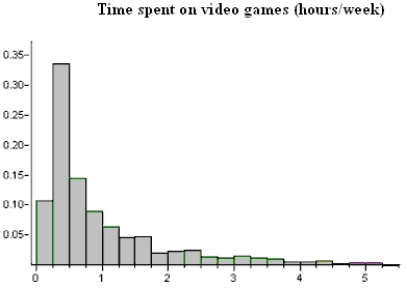 Suppose we were to take a random sample, n = 4, from this population of freshmen and ask them how much time they spent playing video games per week. Describe the shape, center, and spread of the sampling distribution of
  .
.
Correct Answer:
Verified
View Answer
Unlock this answer now
Get Access to more Verified Answers free of charge
Q2: What is a sampling distribution of a
Q3: The closer π is to 0 or
Q4: The sampling distribution of p tends to
Q5: The standard deviation of the distribution of
Unlock this Answer For Free Now!
View this answer and more for free by performing one of the following actions

Scan the QR code to install the App and get 2 free unlocks

Unlock quizzes for free by uploading documents