The data below were gathered on a random sample of 5 basking sharks, swimming through the water and filter-feeding, i.e. passively letting the water bring food into their mouths. 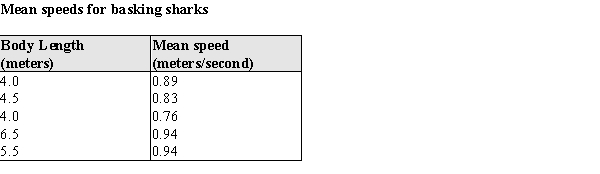
a) What is the value of the correlation coefficient for these data?
b) What is the equation of the least squares line describing the relationship between x = body length and y = mean speed.
c) If these sharks are representative of the population of basking sharks, what would you predict is the mean speed for a filter-feeding basking shark that is 5.0 meters in length? Show any calculations below.
d) The largest basking shark in the sample is measured as 6.5 meters long. Theory predicts a maximum length of about 12.26 meters. Would it be reasonable to use the equation from part (b) above to predict the mean filter-feeding speed for a 12 meter long basking shark? Why or why not?
Correct Answer:
Verified
b)
c) ...
View Answer
Unlock this answer now
Get Access to more Verified Answers free of charge
Q3: Pearson's correlation coefficient, r, does not depend
Q4: If on average y increases as x
Q5: The breeding success of birds that nest
Q6: The least squares line passes through the
Q7: The value of the residual plus
Q9: If a scatter plot exhibits a strong
Q10: The coefficient of determination is equal to
Q11: What is it that the Pearson correlation
Q12: The standard deviation about the least squares
Q13: A transformation, or reexpression, of a variable
Unlock this Answer For Free Now!
View this answer and more for free by performing one of the following actions

Scan the QR code to install the App and get 2 free unlocks

Unlock quizzes for free by uploading documents