The use of small aircraft with human observers is common in wildlife studies where the goal is to estimate the abundance of different species. Recently there has been interest in using unmanned aerial vehicles (UAV). The UAV, something about the size of a model airplane, would fly over the area of interest and take pictures to be analyzed by computers with imagery software when the UAV returns. The plot below is from a test run of the UAV over 10 areas in South Central Florida, using bird decoys to test the reliability of the process. 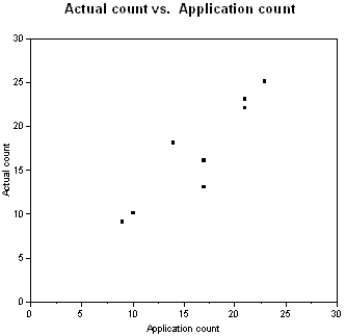
(a) The least squares best fit line is 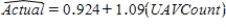 . Plot this line on the graph above. Show any calculations in the space below.
(b) The least squares line is the line that minimizes the sum of the squared residuals. On the graph above pick 2 points and sketch the residuals associated with those points.
Correct Answer:
Verified
View Answer
Unlock this answer now
Get Access to more Verified Answers free of charge
Q27: The data below were gathered on a
Q28: One of the problems when estimating the
Q29: The correlation coefficient between the consumption of
Q30: Assessing the goodness of fit of a
Q31: Exhibit 5-5
During the first 3 centuries AD,
Q33: An independent, or explanatory, variable is the
Q34: The Des Moines Register recently reported the
Q35: When children and adolescents are discharged from
Q36: As early as 3 years of age,
Q37: Exhibit 5-4
Biological theory suggests that the relationship
Unlock this Answer For Free Now!
View this answer and more for free by performing one of the following actions

Scan the QR code to install the App and get 2 free unlocks

Unlock quizzes for free by uploading documents