A statewide survey released by the University of Iowa Injury Prevention Research Center was designed to assess compliance with Iowa seatbelt law. The table below shows the results for 5 Iowa cities. 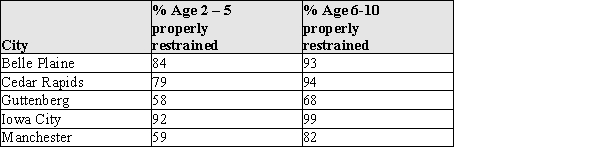 (a) Display these data in a comparative bar chart so that the different ages can be compared for the different cities. (b) Write a brief description of the differences and similarities in the patterns you observe in your bar chart for part (a).
Correct Answer:
Verified
View Answer
Unlock this answer now
Get Access to more Verified Answers free of charge
Q8: If the upper tail of a distribution
Q9: An outlier is an unusually small or
Q10: Each person in a sample of 800
Q11: Investigators writing in the Journal of Early
Q12: A pie chart is most useful for
Q14: An experiment was performed to determine which
Unlock this Answer For Free Now!
View this answer and more for free by performing one of the following actions

Scan the QR code to install the App and get 2 free unlocks

Unlock quizzes for free by uploading documents